Graphs, diagrams and infographics
- Include explanatory text or alt text in the copy alongside images, graphs and charts.
- Use the SVG file format for presenting charts and data visualisations. This will mean text is readable and the images size can be increased.
- Include explanatory text or alt text in the copy alongside images, graphs and charts.
- Use the SVG file format for presenting charts and data visualisations. This will mean text is readable and the images size can be increased.
For example
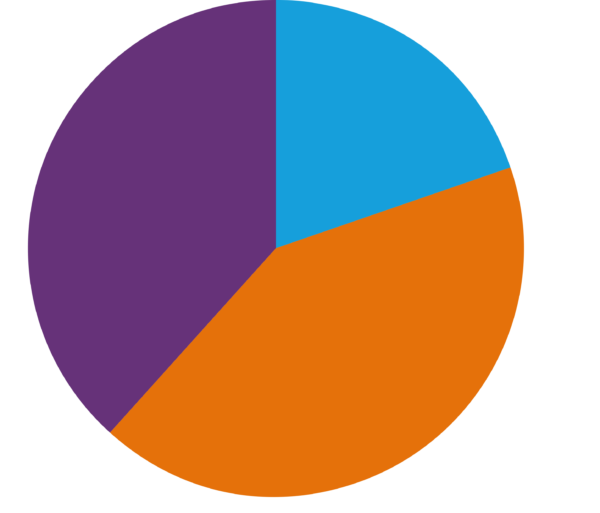
Ages of people with complex disabilities in the UK
Our estimates show that people with complex disabilities in the UK are predominantly adults, aged 18 and over. If we look at the break down by age group, we can see that 42% are between 18-64 (approximately 667,000 people) and 38% are over 65 (approximately 606,000 people). For the younger age group, our analysis indicates that 20% of people are between 0-17 years old (approximately 318,000 people).
| Age group | Number of people |
 0-17 years 0-17 years | 318,339 |
 18-64 years 18-64 years | 667,417 |
 Over 65 years Over 65 years | 606,155 |