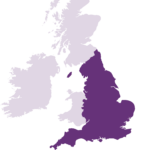
There are 1.4 million people with complex disabilities in England.
Of the 1.6 million people estimated to be living in the UK with complex disabilities, 1.4 million are in England. We have broken down this data by demographic and region to provide insights at a local level.
According to our research, the largest regional estimated population is in the North West. Here, there are just over 200,000 people with complex disabilities.
Region
Number of people
East
154,535
East Midlands
129,260
London
179,938
North East
88,452
North West
201,249
South East
179,356
South West
147,567
West Midlands
186,457
Yorkshire and The Humber
111,529
England
1,378,343
The demographics of people with complex disabilities in England
Our analysis allows us to estimate how many people fall into different demographic groups across England.
Age group
Number of people
0-17 years
282,501
18-64 years
566,421
Over 65 years
529,420
Sex
Number of people
Male
751,047
Female
627,295
Ethnic minority group
Number of people
Asian
62,226
Black
36,484
Mixed/Other
37,379
Complex disabilities by region
We are able to provide information at a local level about the prevalence of people with complex disabilities.
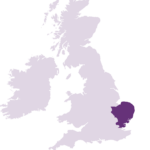
East
Our estimates have shown that there are approximately 154,000 people with complex disabilities living in the East of England. Analysis suggests that the characteristics of these people are as follows.
Age group
Number of people
0-17 years
33,376
18-64 years
59,935
Over 65 years
61,224
Sex
Number of people
Male
84,163
Female
70,372
Ethnic minority group
Number of people
Asian
4,030
Black
2,305
Mixed/Other
3,142
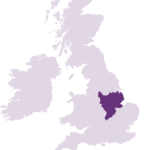
East Midlands
Our estimates have shown that there are approximately 129,000 people with complex disabilities living in the East Midlands. Analysis suggests that the characteristics of these people are as follows.
Age group
Number of people
0-17 years
22,293
18-64 years
52,894
Over 65 years
54,073
Sex
Number of people
Male
68,838
Female
60,422
Ethnic minority group
Number of people
Asian
4,487
Black
2,238
Mixed/Other
1,959
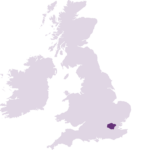
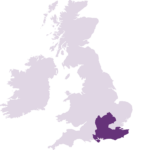
London
Our estimates have shown that there are approximately 180,000 people with complex disabilities living in London. Analysis suggests that the characteristics of these people are as follows.
Age group
Number of people
0-17 years
49,095
18-64 years
87,083
Over 65 years
43,760
Sex
Number of people
Male
102,215
Female
77,723
Ethnic minority group
Number of people
Asian
23,984
Black
18,257
Mixed/Other
14,739
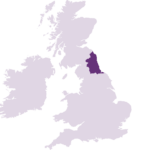
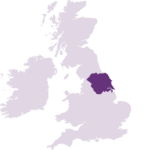
North East
Our estimates have shown that there are approximately 88,000 people with complex disabilities living in the North East. Analysis suggests that the characteristics of these people are as follows.
Age group
Number of people
0-17 years
15,382
18-64 years
38,403
Over 65 years
34,667
Sex
Number of people
Male
46,647
Female
41,806
Ethnic minority group
Number of people
Asian
763
Black
602
Mixed/Other
752
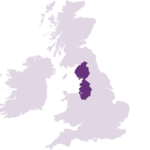
North West
Our estimates have shown that there are approximately 201,000 people with complex disabilities living in the North West. Analysis suggests that the characteristics of these people are as follows.
Age group
Number of people
0-17 years
39,387
18-64 years
88,337
Over 65 years
73,525
Sex
Number of people
Male
108,800
Female
92,449
Ethnic minority group
Number of people
Asian
6,531
Black
2,417
Mixed/Other
3,622
South East
Our estimates have shown that there are approximately 179,000 people with complex disabilities living in the South East. Analysis suggests that the characteristics of these people are as follows.
Age group
Number of people
0-17 years
29,837
18-64 years
59,929
Over 65 years
89,590
Sex
Number of people
Male
98,699
Female
80,656
Ethnic minority group
Number of people
Asian
6,972
Black
3,236
Mixed/Other
5,100
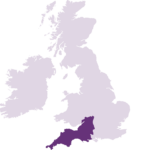
South West
Our estimates have shown that there are approximately 148,000 people with complex disabilities living in the South West. Analysis suggests that the characteristics of these people are as follows.
Age group
Number of people
0-17 years
27,436
18-64 years
53,235
Over 65 years
66,896
Sex
Number of people
Male
79,350
Female
68,217
Ethnic minority group
Number of people
Asian
1,536
Black
921
Mixed/Other
1,901
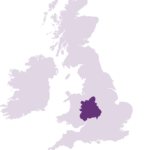
West Midlands
Our estimates have shown that there are approximately 186,000 people with complex disabilities living in the West Midlands. Analysis suggests that the characteristics of these people are as follows.
Age group
Number of people
0-17 years
41,558
18-64 years
74,606
Over 65 years
70,293
Sex
Number of people
Male
99,797
Female
86,660
Ethnic minority group
Number of people
Asian
9,344
Black
5,033
Mixed/Other
3,463
Yorkshire and The Humber
Our estimates have shown that there are approximately 112,000 people with complex disabilities living in Yorkshire and The Humber. Analysis suggests that the characteristics of these people are as follows.
Age group
Number of people
0-17 years
24,139
18-64 years
51,999
Over 65 years
35,390
Sex
Number of people
Male
62,539
Female
48,990
Ethnic minority group
Number of people
Asian
4,578
Black
1,477
Mixed/Other
2,700
Where do these numbers come from?
These figures come from analysis we completed with the National Centre for Social Research. We used data from the Department for Work and Pensions Family Resources Survey, in combination with historic and future estimates of the make-up of the UK population.